4 minutes
Acrylic Topo Maps
As mentioned before, I decided to hand-make as many Christmas gifts as possible this year. I’ve been collecting cool tools, but haven’t really done enough to use them or exercise my creativity.
One of the things that I decided to make was a set of acrylic laser-etched topographical maps. I couldn’t find any easy examples online, but I know that I’ve seen similar things before–basically, you use a laser cutter to remove material from the back of a block of acrylic, leaving a 3D model of terrain carved into the block.
To start with, I wasn’t actually sure that I could do it, or get it to work. Digital elevation data is available online, but it’s never it the right format, and I wasn’t sure what the end result would look like, so I decided to do a test run. I have a lot of family in the northwest corner of Washington State, so I grabbed the first plausable looking map data that I saw from USGS and set some of it up for printing. The first sample was actually a slice of Vancouver Island:
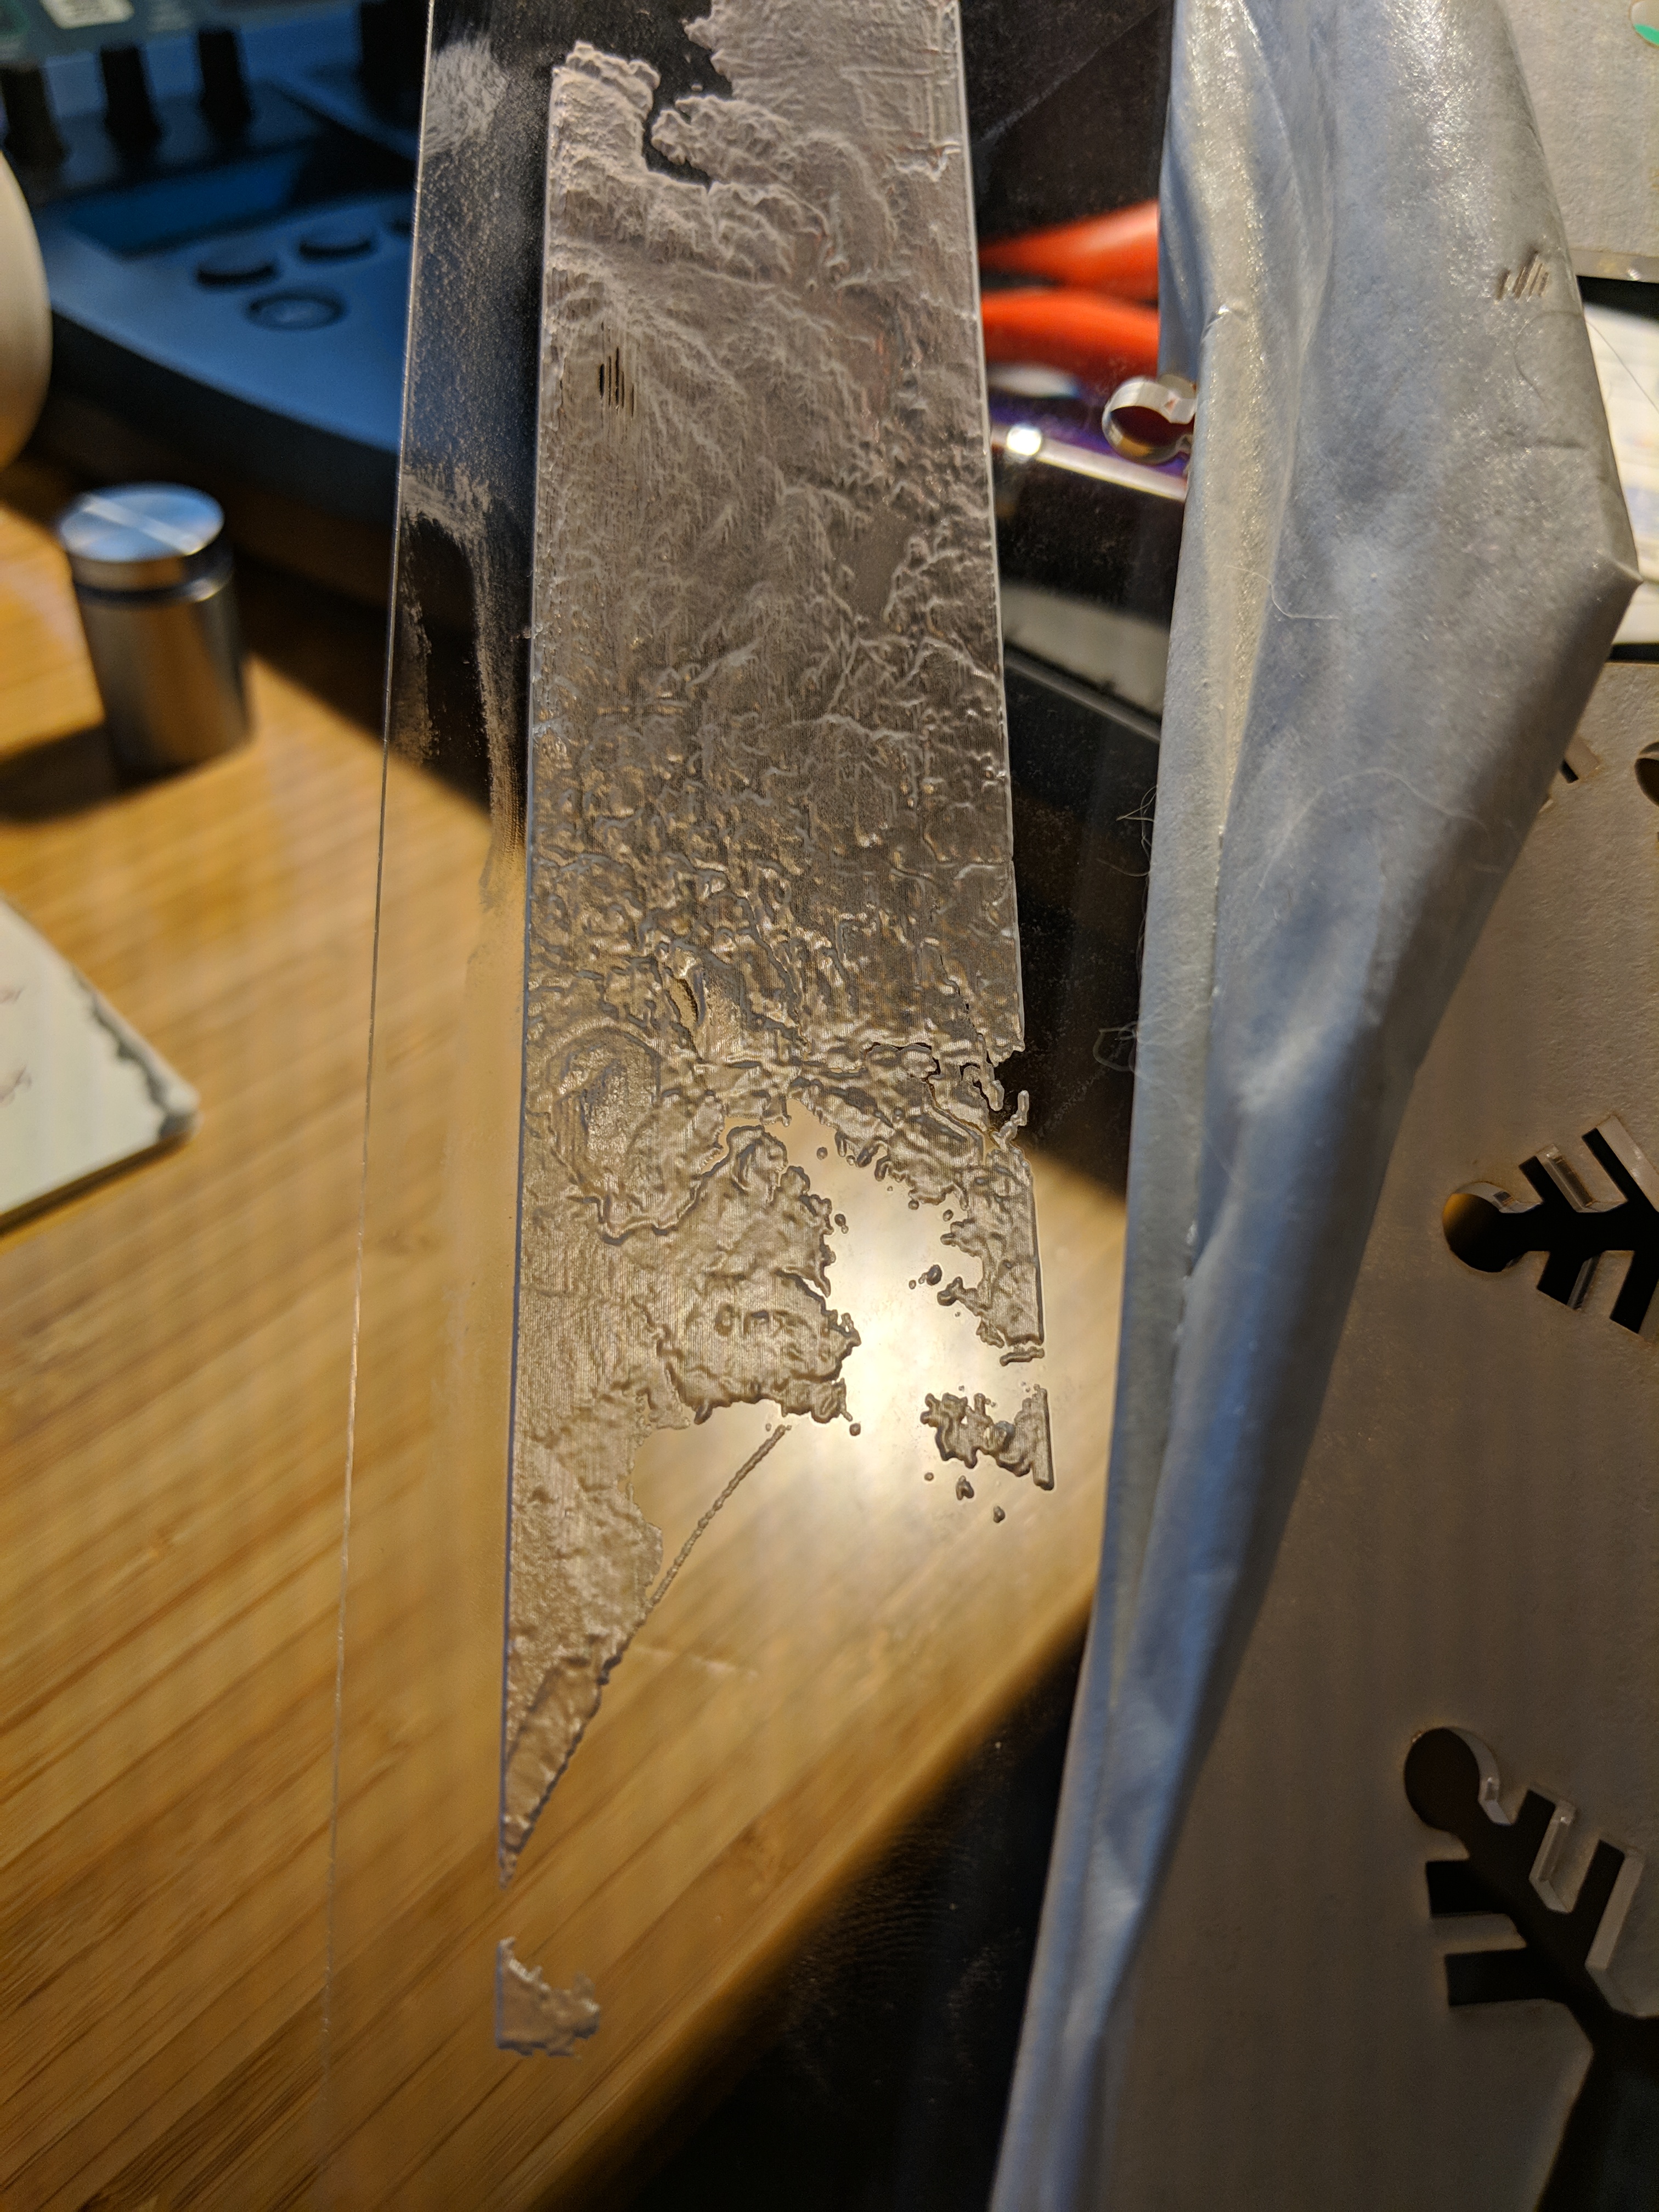
There are a few problems here–the laser cut all the way through one of the hills on the upper left, for example. On the other hand, the coastline and hills look awesome.
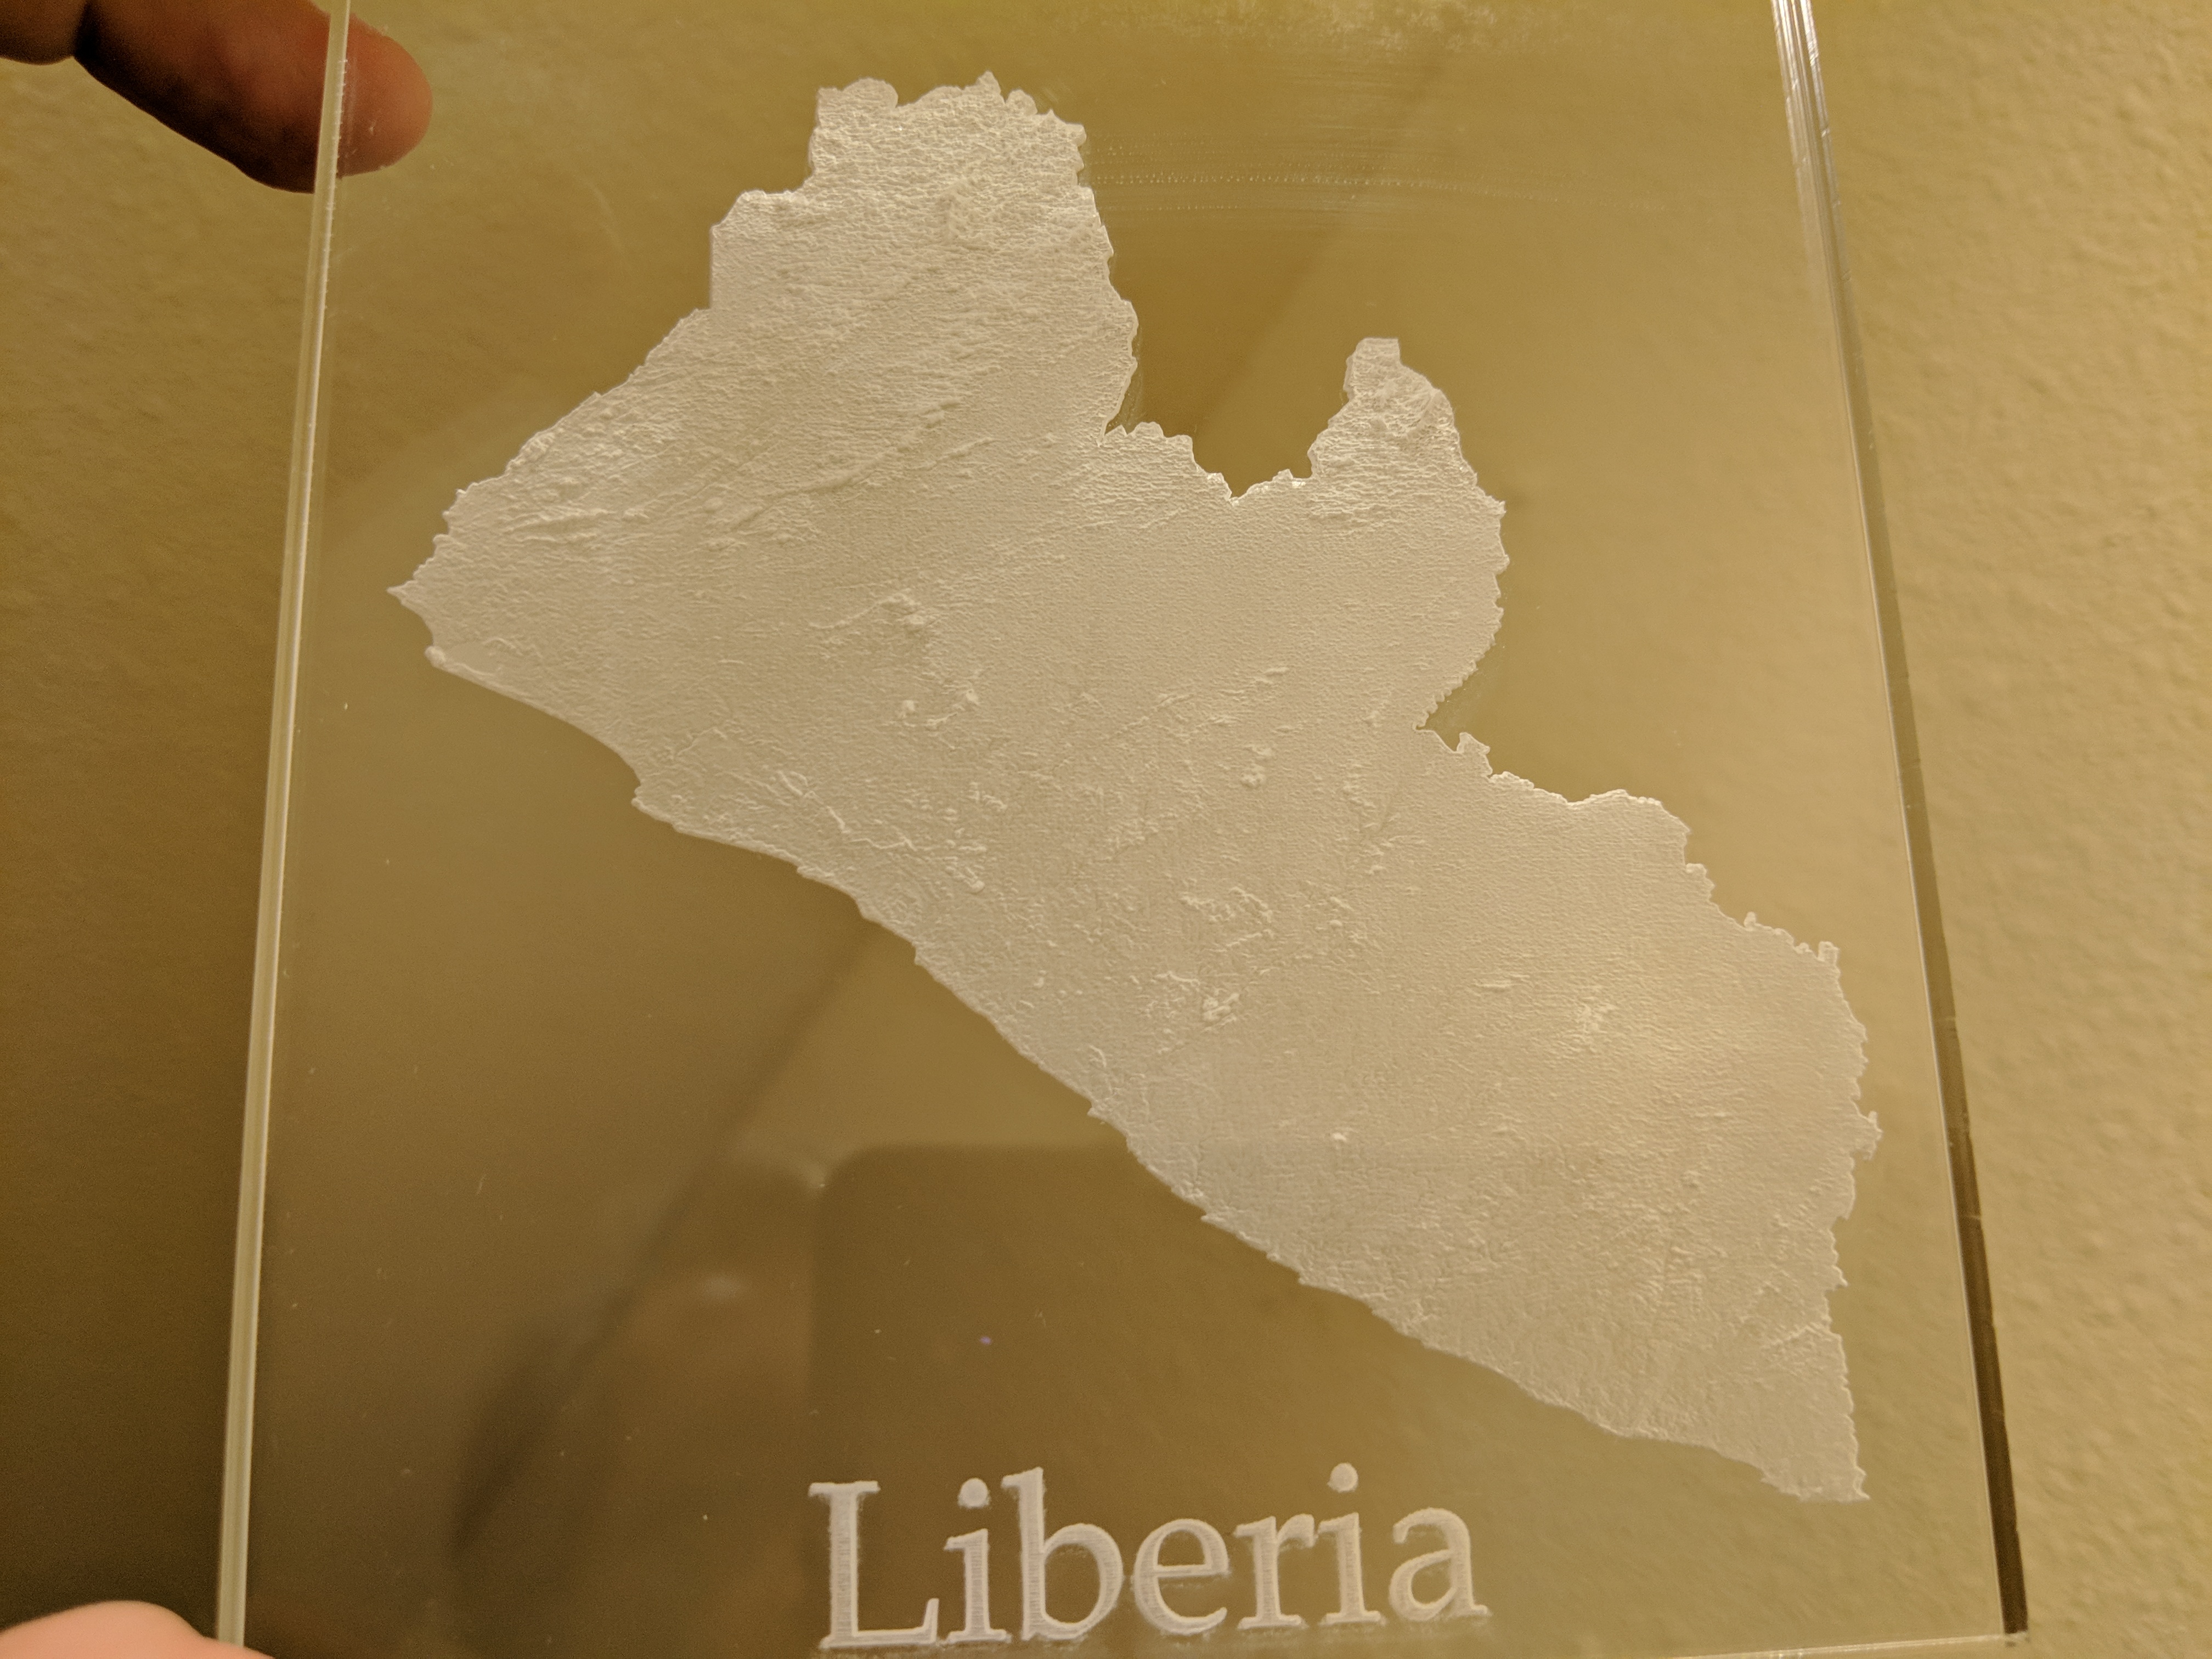
Since I had maps of Washington (and southern Canada) well in hand… I decided to print part of Africa next. Getting mapping data for anywhere in the world (at least at low-ish resolution) is easy. Getting political map boundries in a format that you can use to crop the topo map data: hard. Most of my prep time here was spent aligning my mask of Liberia and my topo data of Liberia to make the country boundries land in the right place. Here’s the result:
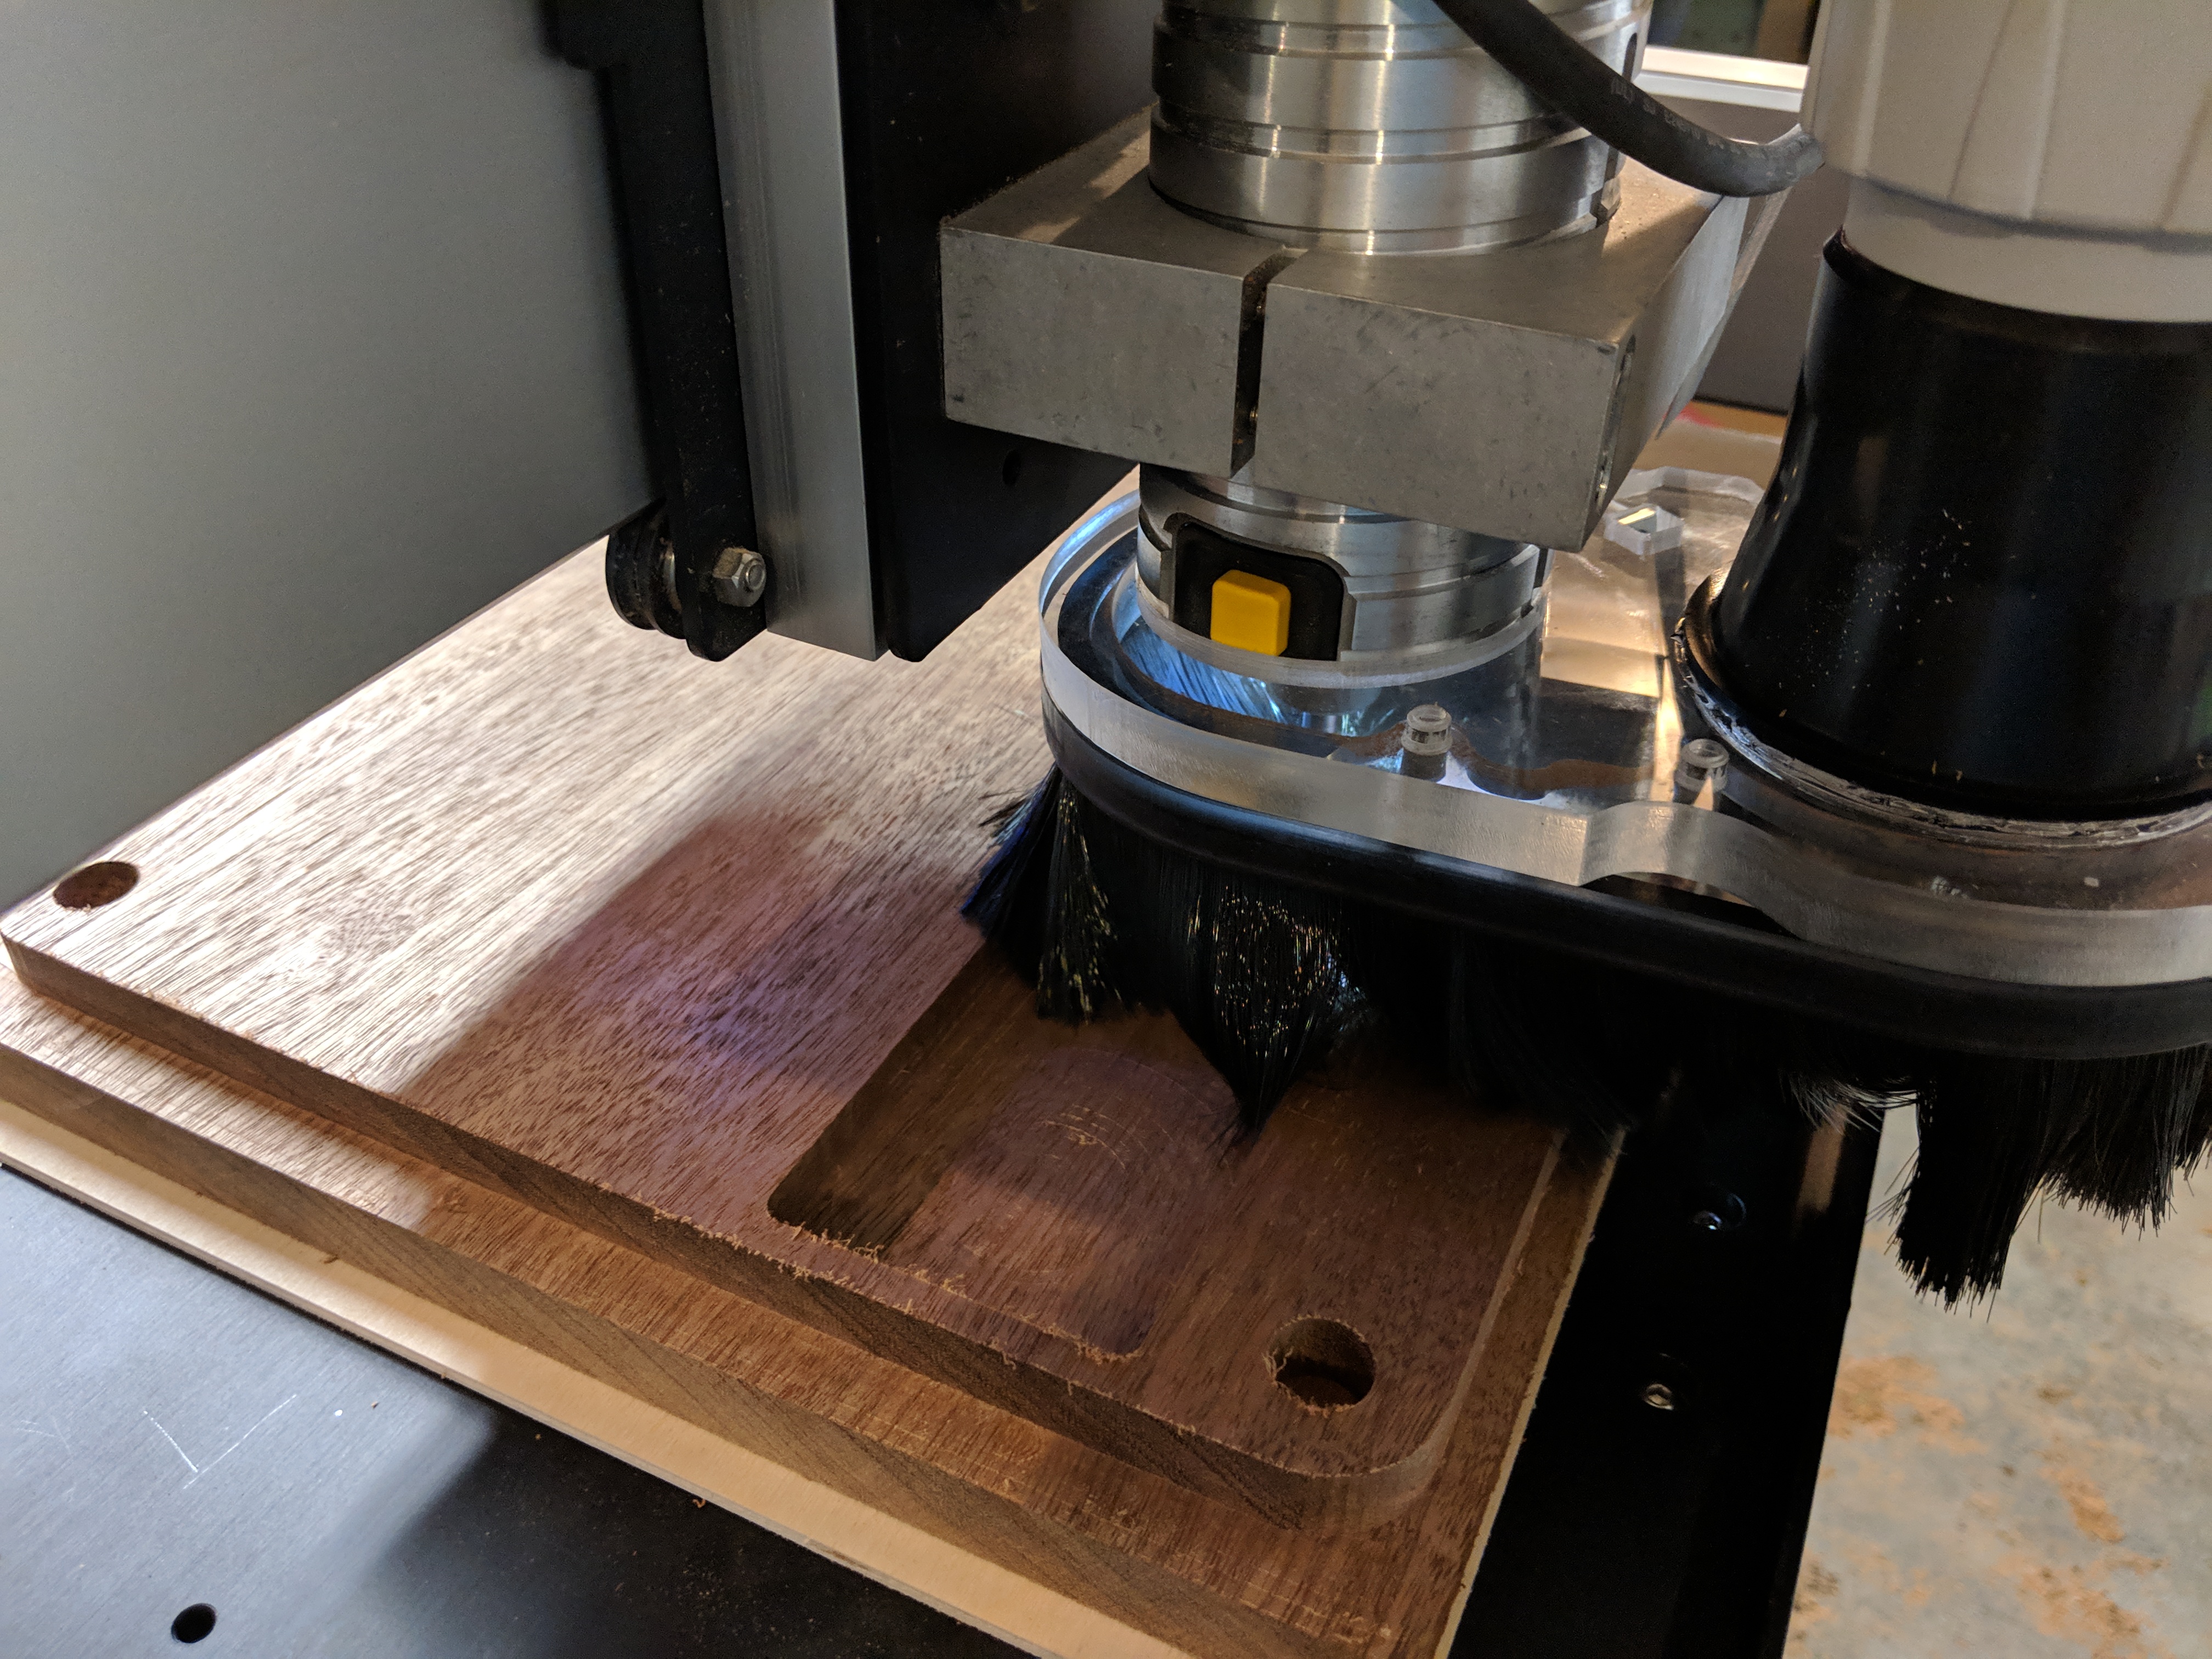
Once I had that in hand, I needed something to mount it on. I bought a small CNC router, but had never really used it to do anything interesting. This seemed like the perfect opprotunity to start.
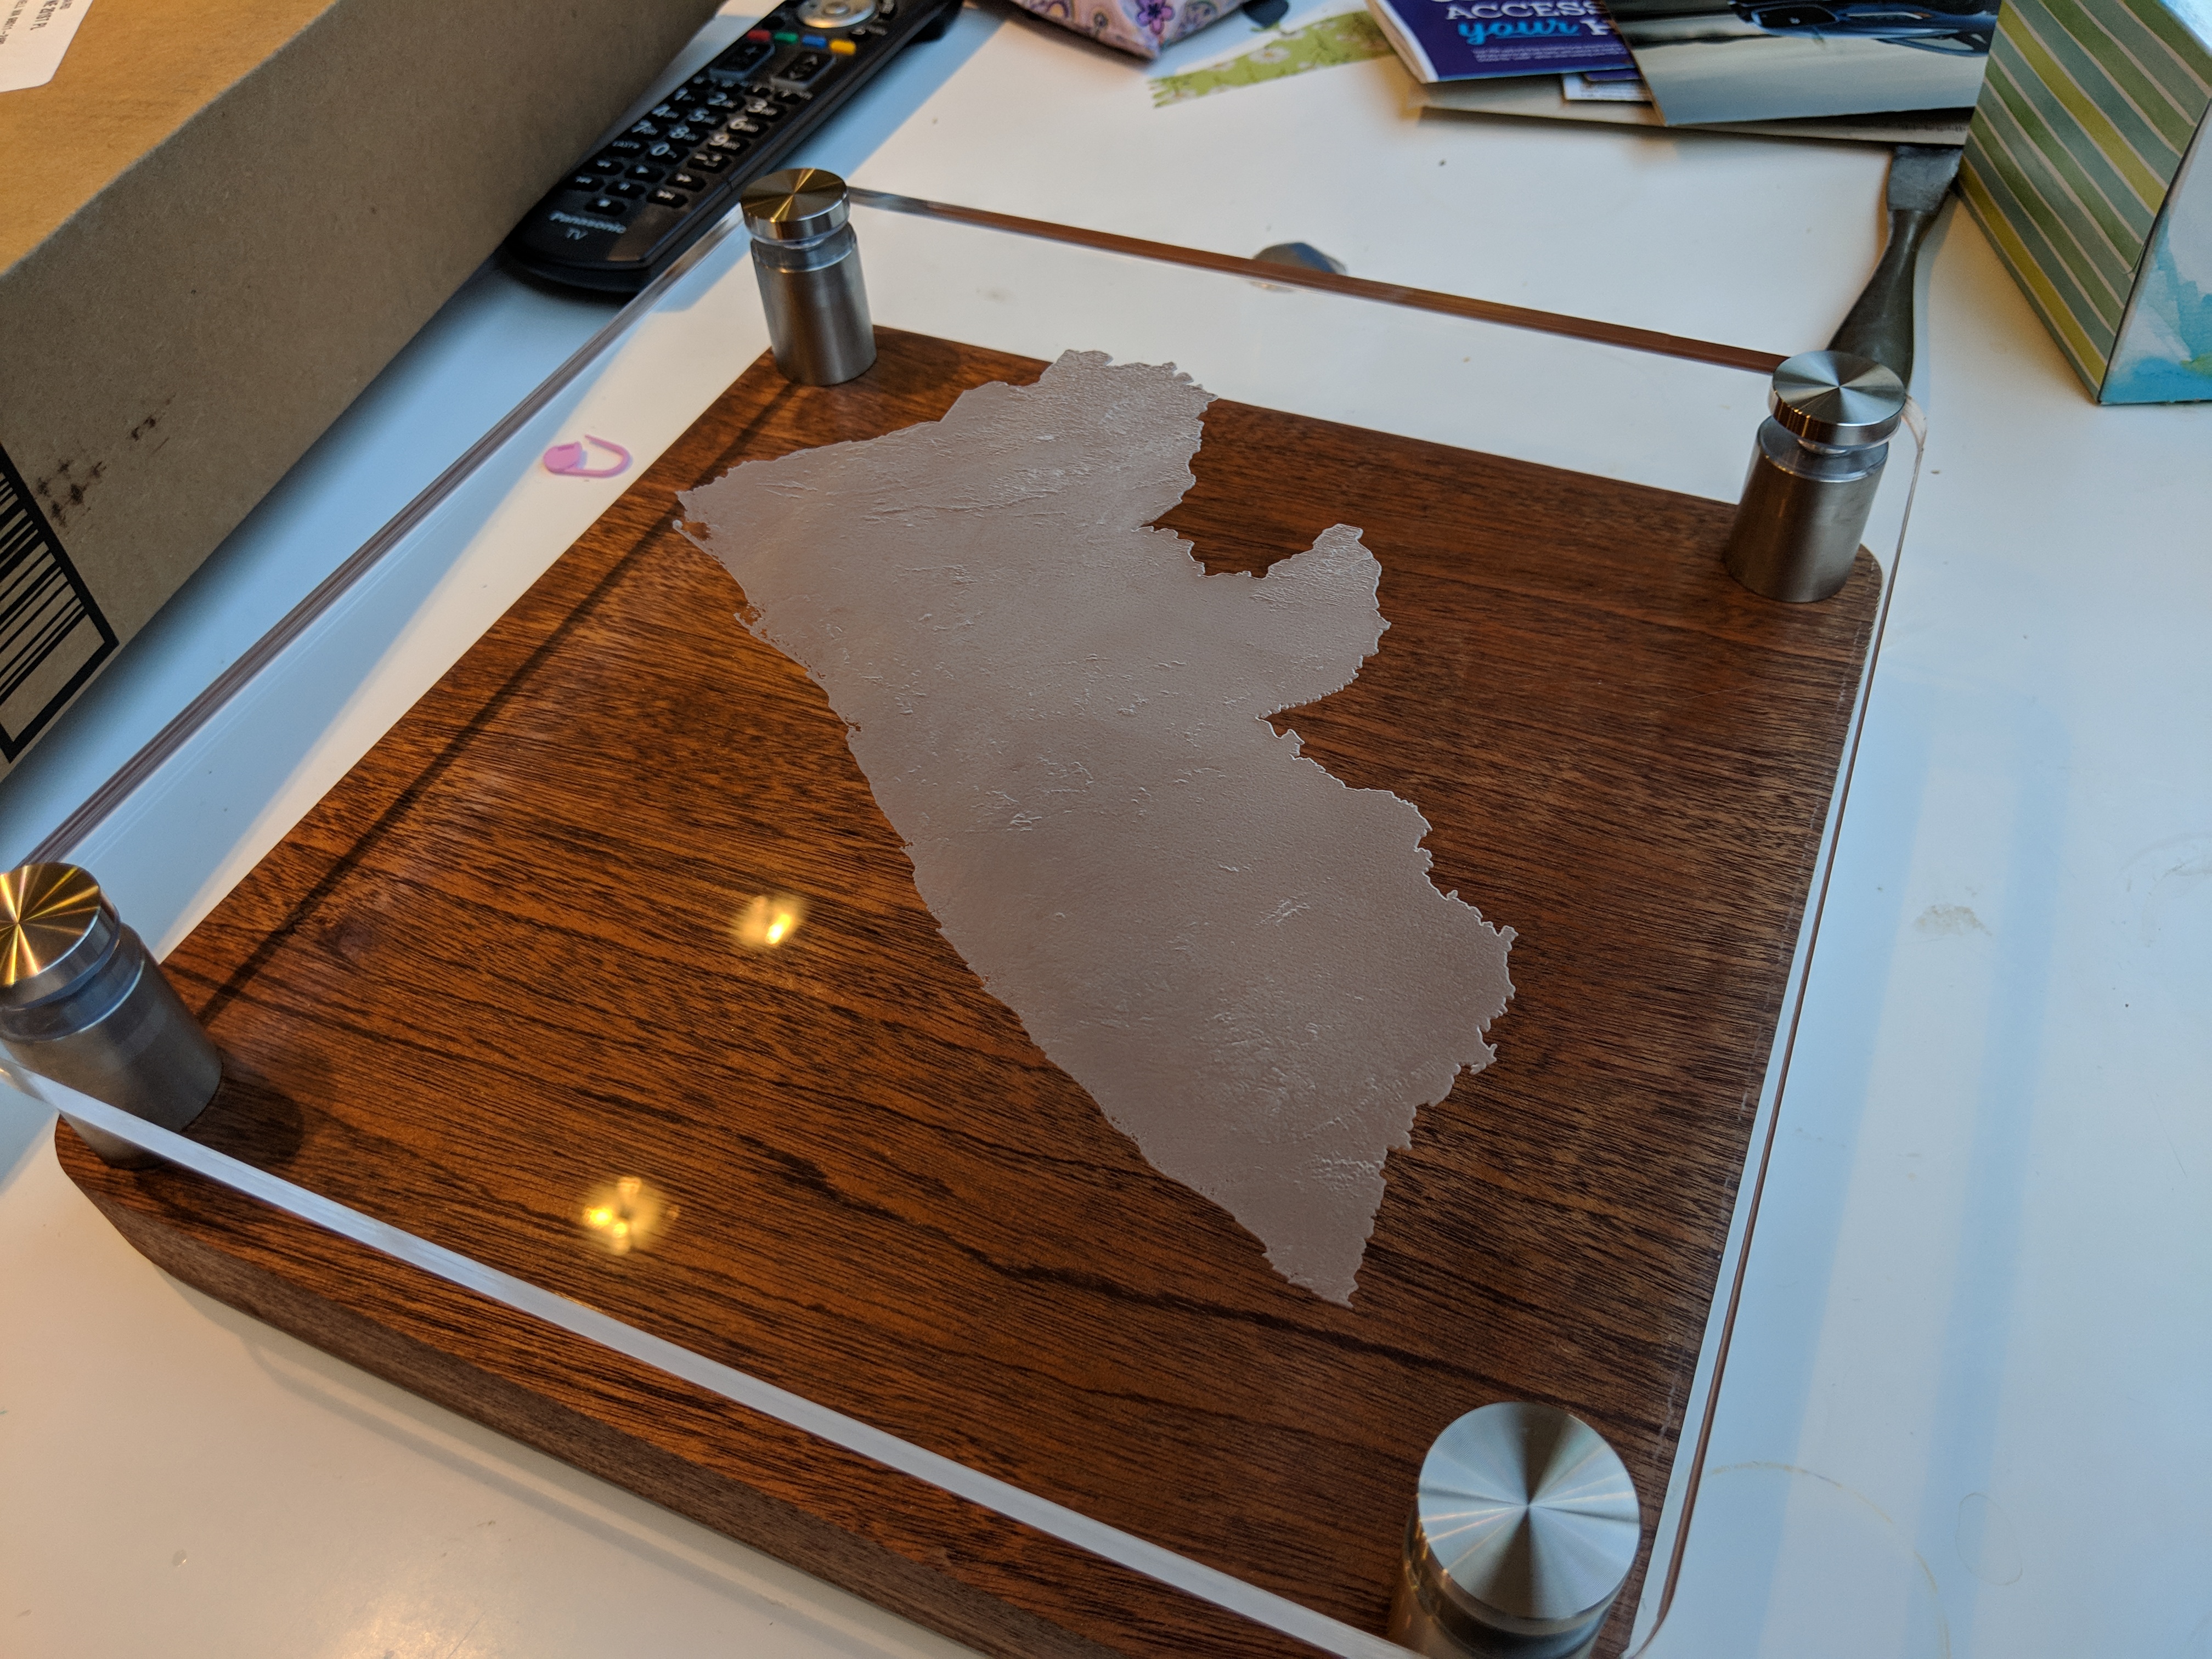
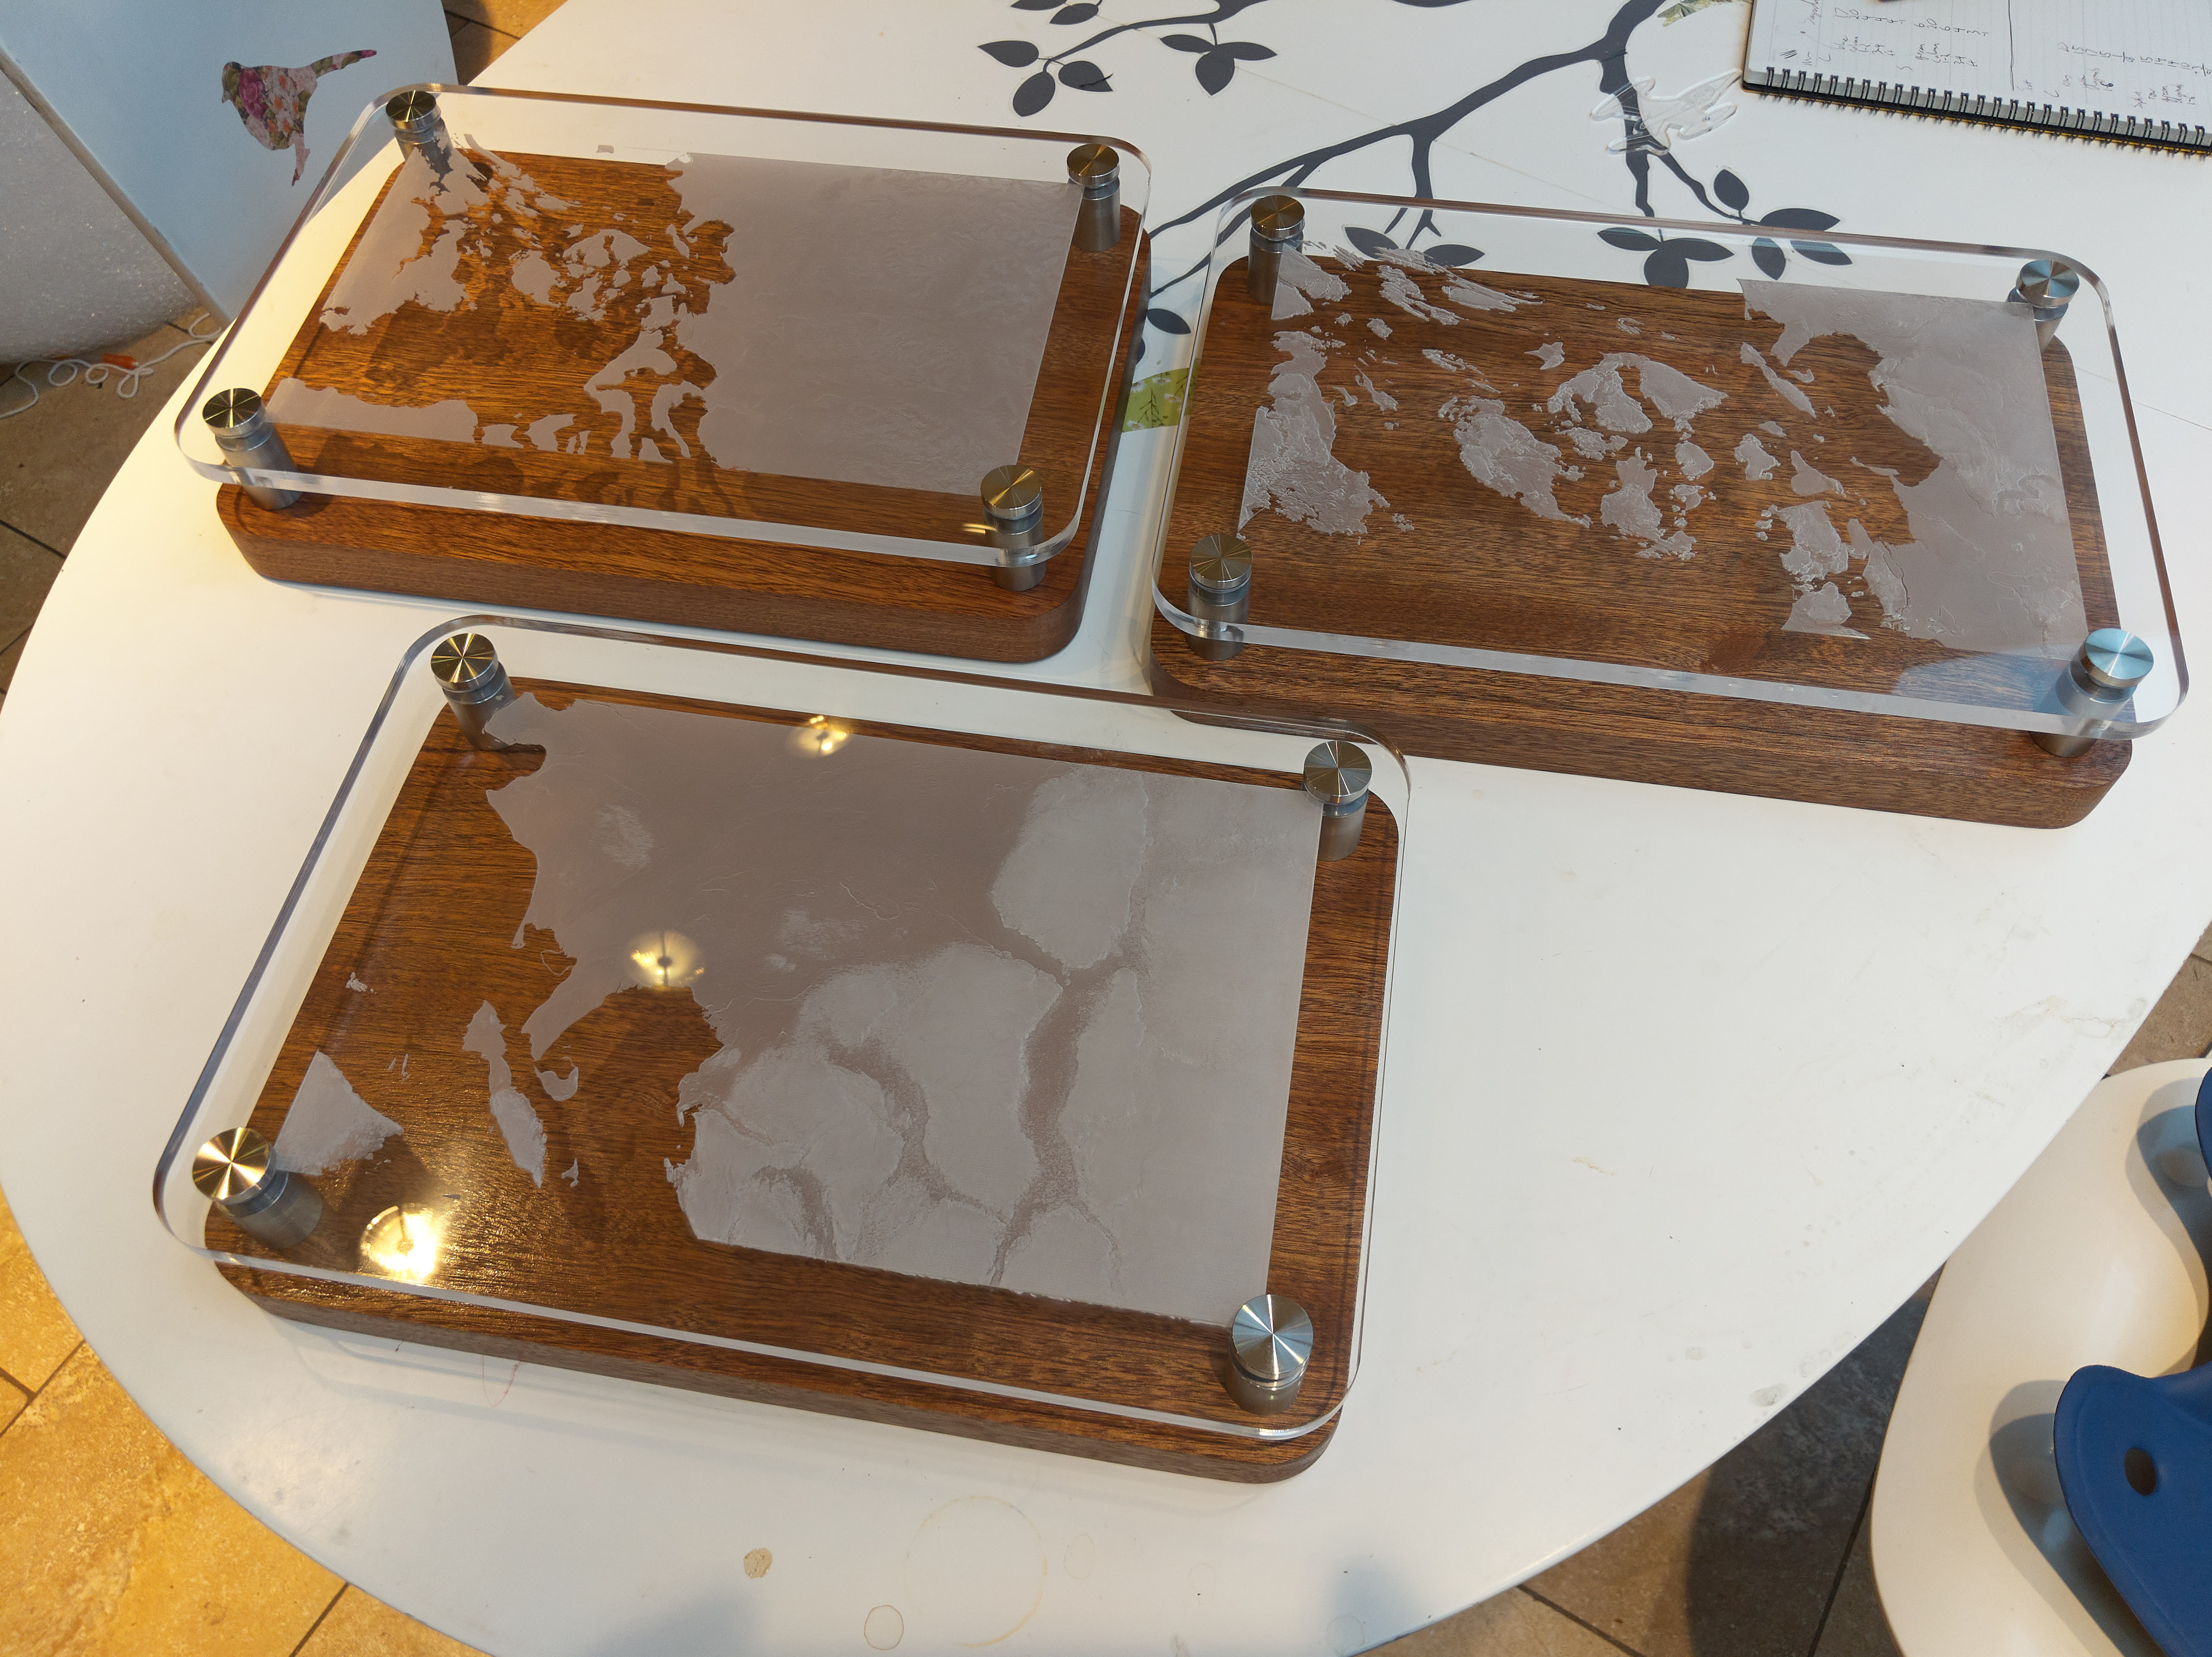
Here’s the finished result, ready to be shipped off.
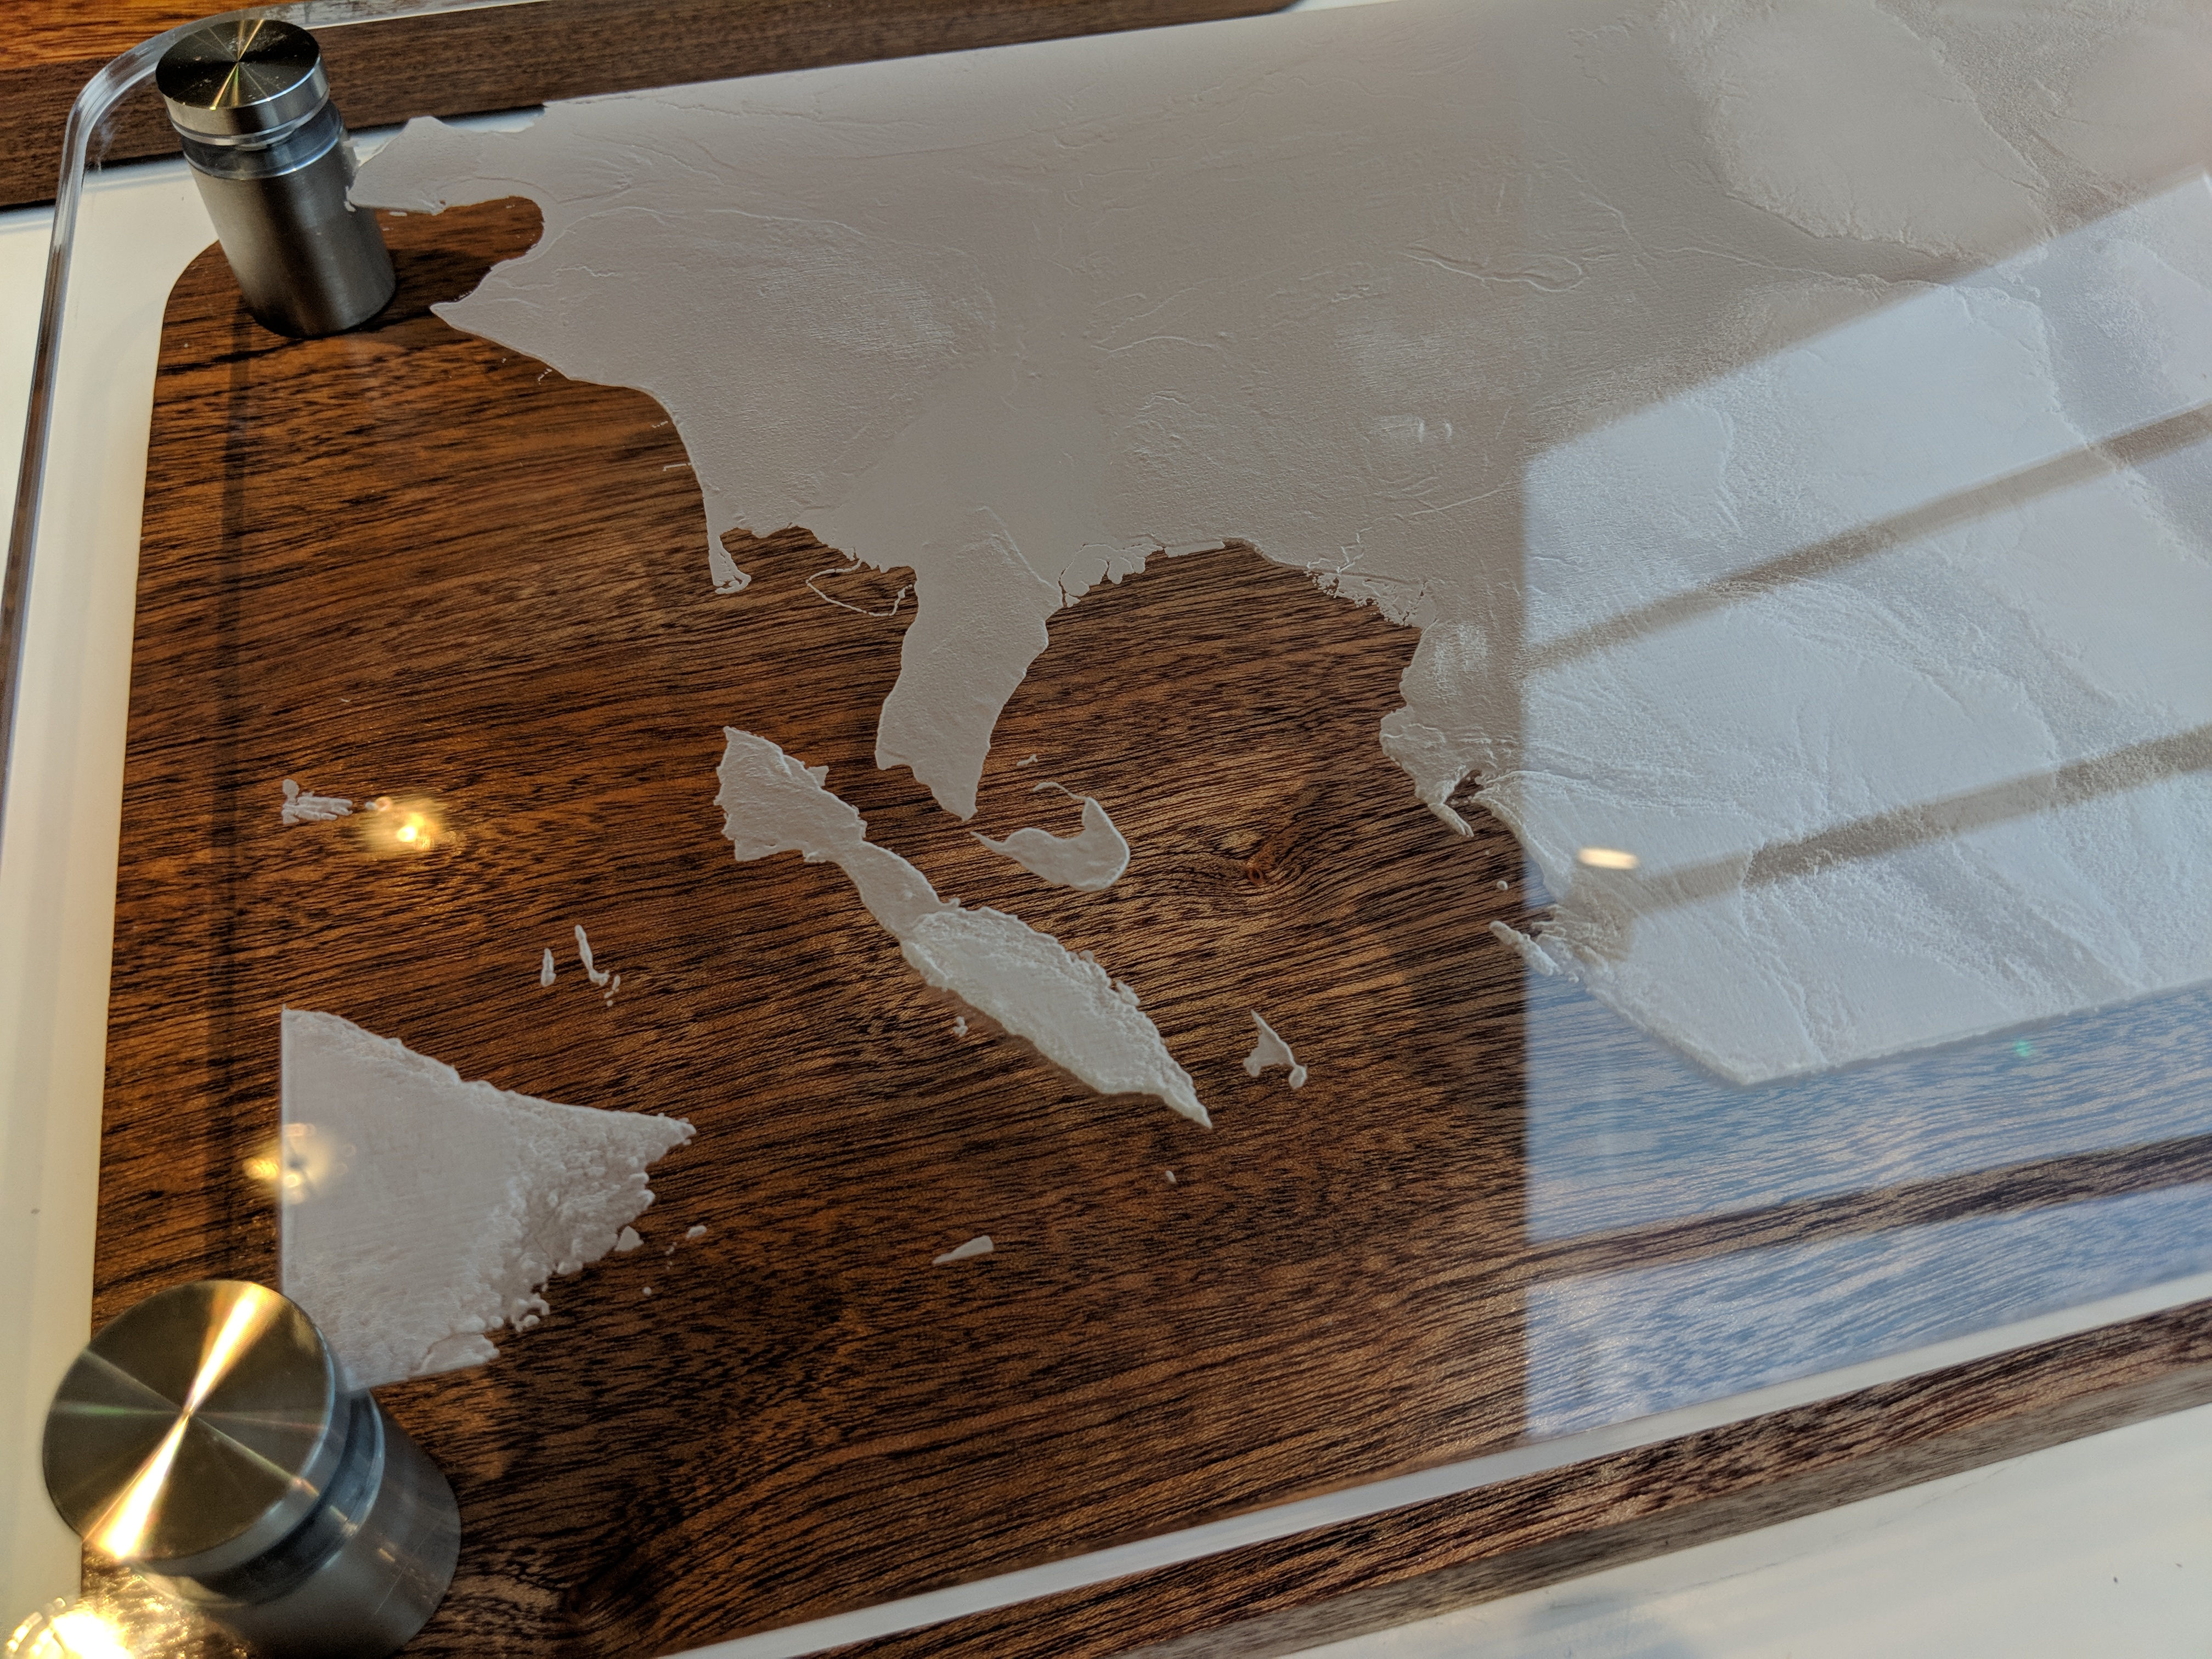
Once that was done, I went back to working on maps of Washington. I ended up doing 3 different views of Western Washington and the San Juan Islands for different people.
A few things I learned:
- Digital Elevation Map data is easy to load into Photoshop, but it’s a pain to work with. Depending on the source, some of the data I worked with was 16 bit and some was 32 bit. Photoshop can load 32-bit greyscale images, but it loses a lot of tools in 32-bit mode. Even worse, the vast bulk of the image data was crammed into a tiny range of the 32-bit space. The upshot was that the whole image looked black, and most of the good tools for boosting the brightness wouldn’t work. If I recall correctly, the ’exposure’ tool did work; I pumped everything up a ways and then converted to 16-bit grayscale.
- Pay attention to black and white levels. My first couple attempts went well. Then I got cocky, and I had a run of… let’s just call it “global warming” and “ice ages”, where my black levels moved and coastlines either flooded or were left covered in rendering artifacts. Adding an adjustment layer in Photoshop to boost the visibility of shades very near to sea level really helps.
- Mirror. You’re printing from the back, so mirror your image left-to-right.
- Invert. Generally, DEM data has brightest colors (white) as highest, and lasers engrave darkest colors the deepest. So you’ll need to invert your image to get it to print right.
- Like any image, go easy on the processing. I did one test where I cranked unsharp mask way up. It gave me nice, dramatic hills and mountains. And added reefs around every island. Oops.